Orientation
When a scientist asks a question, the next step is to turn that question into a hypothesis – a tentative, testable answer. Writing a good hypothesis helps children focus their investigation, choose what to measure, and decide what counts as a successful result. This article explains the key parts of a hypothesis, provides several ready‑made examples, and gives a complete, hands‑on experiment that lets kids practice writing and testing their own predictions.
Before You Begin
- Choose a quiet workspace with a flat surface where a paper airplane can glide without interference.
- Adult supervision is recommended for children under 10 to help with cutting paper and handling any scissors.
- Gather a notebook or a spreadsheet for recording results; a ruler or measuring tape will be useful for measuring flight distance.
Materials
- Standard printer paper (8.5 × 11 in) – at least 30 sheets.
- Scissors (optional, for trimming to smaller sizes).
- Measuring tape or a 1‑m ruler.
- Stopwatch (a phone timer works fine).
- Notebook, spreadsheet, or printed data table (provided below).
Testable Question
Formulate a question that can be answered with a single measurable outcome. For this project a suitable question is:
“How does the size of a paper airplane affect the distance it travels when launched with the same throwing technique?”
This question contains a clear independent variable (paper size) and a dependent variable (flight distance).
Hypothesis
A hypothesis must state a relationship between the independent and dependent variables and be phrased as a prediction. Use the classic if … then … format:
- Example 1 (simple): If the paper airplane is made from a larger sheet of paper, then it will travel a shorter distance because the extra weight slows it down.
- Example 2 (quantitative): If the wingspan is increased by 2 inches, then the flight distance will increase by at least 10 cm.
- Example 3 (null hypothesis): Changing the paper size will not affect the flight distance.
These examples follow the guidance from Science Buddies and BBC Bitesize, which define a hypothesis as a testable, tentative answer that leads to predictions [1] and emphasize the link between hypothesis and prediction [2].
Variables and Controls
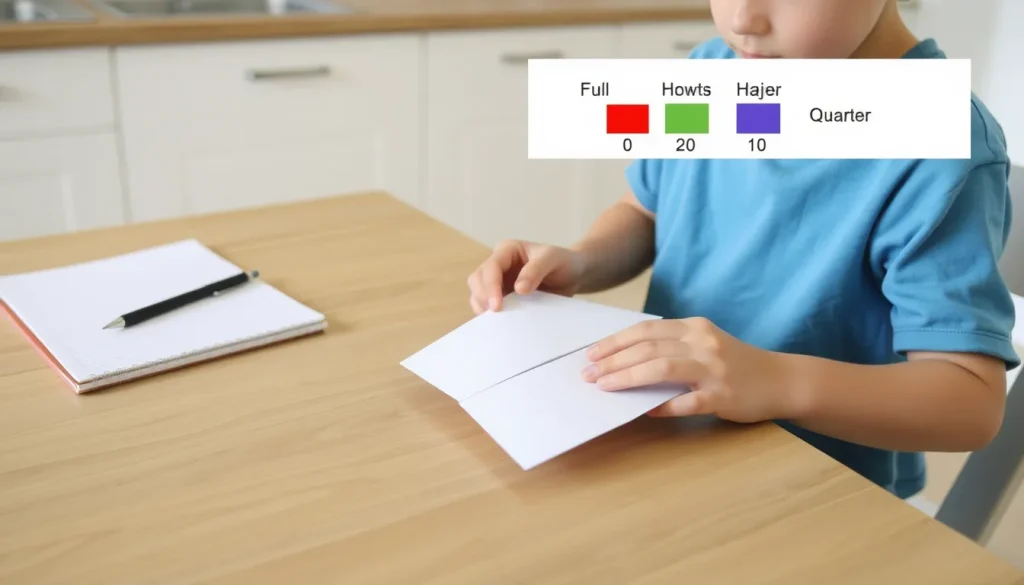
- Independent variable: Paper size (e.g., full‑size 8.5 × 11 in, half‑size 5.5 × 8.5 in, quarter‑size 4.25 × 5.5 in).
- Dependent variable: Horizontal distance traveled (centimetres) measured from the launch point to where the airplane first touches the floor.
- Controlled variables: Type of paper (same weight), folding pattern (use the same basic dart design for all sizes), launch angle (keep arm at roughly 45°), and indoor conditions (no wind, level floor).
Steps (Procedure)
- Cut the paper into three size groups: full, half, and quarter. Label each pile.
- Fold each sheet into the same basic dart airplane design. Keep the folds tight and identical for every plane.
- Mark a launch line on the floor with tape; this is where all throws will start.
- Choose one size group and, from the same position, throw three airplanes using the same arm motion. Record each flight distance.
- Repeat step 4 for the other two size groups, always using the same launch line and throw technique.
- Calculate the average distance for each size group.
- Compare the averages to see whether the data support your hypothesis.
What to Observe or Measure
- Distance (centimetres) from launch line to landing point.
- Qualitative notes: does the plane wobble, dive, or glide smoothly?
- Time of flight (seconds) if you wish to explore speed (optional).
Repeated Trials
Perform at least three throws per size group. Repeating the test reduces random error and shows whether results are consistent. If the three throws for a size differ widely, consider adding two more trials.
Data Table
| Paper Size | Trial 1 | Trial 2 | Trial 3 | Average |
|---|---|---|---|---|
| Full (8.5 × 11 in) | ||||
| Half (5.5 × 8.5 in) | ||||
| Quarter (4.25 × 5.5 in) |
Graphing Your Results
Create a simple bar graph: the x‑axis lists the three paper sizes, and the y‑axis shows average distance (cm). Bars make it easy to see which size travelled farthest. If you have access to spreadsheet software, a column chart works well.
The Science Explained
Paper airplanes fly because lift is generated when air flows over the wings. Larger wings (or larger overall size) increase surface area, which can create more lift, but they also add weight. In a small indoor space, the added weight often outweighs the lift benefit, causing the plane to fall sooner. This trade‑off between lift and weight is the core physics concept the experiment explores.
Because the experiment uses the same paper type and folding design, the only systematic difference is size, satisfying the requirement for a fair test.
Worked Example
Suppose a student writes the hypothesis: If the paper airplane is made from a larger sheet, then it will travel a shorter distance. After completing the trials, the averages are:
- Full size: 120 cm
- Half size: 150 cm
- Quarter size: 170 cm
The data show that larger planes travelled less far, so the hypothesis is supported. The student can then discuss why the extra weight likely slowed the larger planes, linking back to the physics explanation.
Troubleshooting
- Inconsistent throws: Practice the launch motion a few times before recording data. Use a marked arm position to keep angle constant.
- Planes crash into walls: Reduce the launch force or move the launch line farther from obstacles.
- Large variation between trials: Check that each plane is folded identically; small differences in wing shape can change performance.
Try Another Version
Change the independent variable to paper weight (use copy paper vs. cardstock) while keeping size constant. This variation lets children explore how material density influences flight.
Next Steps
After analyzing the data, encourage children to write a brief conclusion that restates the hypothesis, summarizes the findings, and suggests a follow‑up question—e.g., “Would adding a paper clip to the nose change the distance?” This practice reinforces the full scientific method.
Related terms
- Hypothesis
- A tentative, testable answer to a scientific question, expressed as a prediction.
- Independent variable
- The factor that the experimenter deliberately changes.
- Dependent variable
- The factor that is measured to see how it responds to the independent variable.
- Control group
- A set of conditions that remain unchanged, used for comparison with experimental groups.