Overview
When the Sun shines on a sidewalk, a metal roof, or a playground bench, the surface temperature can become dramatically higher than the air temperature. The main reasons are albedo (how much light a surface reflects) and thermal conductivity (how quickly heat moves through the material). Dark, matte surfaces absorb most of the solar energy and therefore warm up fastest, while light‑colored or shiny surfaces reflect more light and stay cooler.12 This project lets children compare the heating rate of several everyday materials using only a sunny day, a thermometer (or infrared sensor), and simple household items.
Before You Begin
- Choose a clear, sunny morning when the Sun is high (mid‑morning to early afternoon) and the sky is mostly cloud‑free.
- Identify a flat, level outdoor surface that receives direct sunlight for the full observation period (e.g., a patio, driveway, or roof edge).
- Make sure an adult is present to supervise the use of thermometers and to ensure the experiment site is safe (no traffic, no sharp objects).
- Plan to record data at the same time intervals for each material (e.g., every 5 minutes for 30 minutes).
Materials
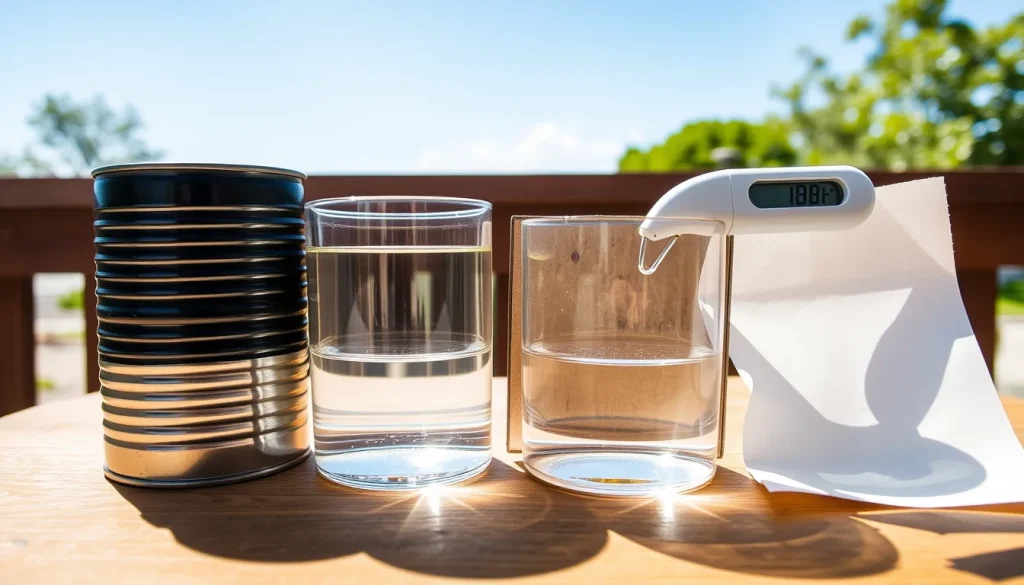
- Four identical shallow containers (plastic cups, small trays, or empty coffee cans). If you only have metal cans, paint the inside and outside of two with flat black spray paint and two with flat white spray paint (see NOAA canned‑heat demo).3
- Thermometer capable of measuring up to at least 80 °C (a kitchen thermometer, a digital probe, or an infrared thermometer).
- Water (enough to fill each container about 2 cm deep – about 200 ml total).
- Masking tape or sticky notes for labeling each container (e.g., “Black metal”, “White metal”, “Cardboard”, “Paper”).
- Stopwatch or phone timer.
- Notebook or printable data table (provided below).
Optional everyday materials you can test in addition to the four listed above:
- Piece of cardboard (≈10 cm × 10 cm).
- Sheet of printer paper (≈10 cm × 10 cm).
- Aluminum foil (shiny side up).
- Dark‑colored fabric (e.g., a piece of black t‑shirt).
Procedure (Steps)
- Label each container with its material name.
- Fill every container with the same depth of room‑temperature water (measure with a ruler or the container’s markings). Record the starting water temperature for each container – they should be within 1 °C of each other.
- Place all containers side‑by‑side on the chosen sunny surface, making sure they are oriented the same way (e.g., all facing the Sun).
- Start the timer as soon as the containers are in place.
- Every five minutes, record the water temperature in each container. Use the same thermometer for all measurements, cleaning the probe between readings if needed.
- Continue recording for at least 30 minutes or until the temperature rise plateaus (whichever comes first).
- When the observation period ends, carefully move the containers to a shaded area and allow them to cool before cleaning up.
Variables and Controls
- Independent variable: Surface material (color, texture, and thermal conductivity).
- Dependent variable: Water temperature rise (°C) over time.
- Controlled variables: Amount and initial temperature of water, container size, exposure time, Sun angle, wind conditions, and measurement method.
- Control group: If you have a surface you expect to be neutral (e.g., a white‑painted wooden board), include it as a baseline for comparison.
What to Observe or Measure
Record the temperature at each time point in the table below. You may also note any visible changes (e.g., steam, surface color shift) and environmental factors (wind gusts, clouds).
Data Table
| Time (min) | Black metal | White metal | Cardboard | Paper |
|---|---|---|---|---|
| 0 | ||||
| 5 | ||||
| 10 | ||||
| 15 | ||||
| 20 | ||||
| 25 | ||||
| 30 |
Graphing Your Results
Plot each material’s temperature on the vertical axis (°C) against time on the horizontal axis (minutes). A line graph makes it easy to see which curve rises most quickly. Expect the black‑painted metal to have the steepest slope, followed by dark fabric or cardboard, while the white‑painted metal stays relatively flat.1
The Science Explained
Sunlight is a mixture of visible, infrared, and ultraviolet radiation. When this radiation strikes a surface, three things can happen:
- Reflection: Light bounces off the surface. Light colors (white, pastel) have high albedo and reflect most of the energy.
- Absorption: Light is converted into heat within the material. Dark, matte surfaces have low albedo and absorb a large fraction of the solar spectrum.
- Transmission: Light passes through (transparent materials), which is not a major factor for the opaque items we test.
Absorbed energy raises the temperature of the surface and, by conduction, the water in contact with it. Materials also differ in thermal conductivity. Metals conduct heat quickly, so a hot metal surface transfers warmth to the water faster than wood or cardboard, which are insulating.2 This is why the black‑painted metal can in the NOAA “canned heat” demo becomes noticeably hotter than its white counterpart after just two hours of sun exposure.3
In desert research, pavement that is dark or covered with lamp‑black paint reached surface temperatures over 70 °C, creating a risk of “pavement burns” for barefoot walkers.1 The 1941 study of roof materials found that a lamp‑black surface was the warmest, with green trim paint close behind, confirming that color dominates over material type when the surface is matte.2
Putting these ideas together, the experiment demonstrates two key concepts:
- Albedo controls how much solar energy is captured. Darker colors capture more, leading to faster temperature rise.
- Thermal conductivity determines how quickly that captured energy spreads into the water. Metals spread heat fast, while porous or fibrous materials (cardboard, paper) do so more slowly.
Troubleshooting
- Temperatures are identical for all surfaces. Check that the Sun is shining directly on each container; a shadow from a tree or building will flatten differences.
- Thermometer reads erratic values. Wipe the probe between measurements, and allow it to equilibrate for a few seconds before noting the reading.
- Wind gusts cool some containers more than others. If wind is strong, use a windbreak (a cardboard shield) placed behind the array, keeping the front side exposed to the Sun.
- Paint peels or mixes with water. Use a primer before painting metal cans and allow the paint to cure at least 24 hours before the experiment.
Try Another Version
Once the basic comparison is complete, children can explore extensions:
- Replace water with sand or soil to see how a solid medium stores heat.
- Test reflective foil (shiny side up) versus matte aluminum to isolate the effect of surface finish.
- Measure temperature at night to observe radiative cooling differences among the same surfaces.
- Use a digital data logger to record temperature automatically every minute.
Cleanup and Disposal
Dispose of the water responsibly (pour it down a drain). If you painted cans, let the paint dry completely before storing them. Re‑use the containers for future experiments or recycle them according to local guidelines.
Next Steps
Discuss real‑world applications: why rooftops are often painted white in hot climates, how solar panels are mounted on dark frames, and why astronauts wear reflective blankets in space. Encourage learners to think about design choices that balance heat absorption (for solar collectors) versus heat rejection (for cooling).
Sources & references
- Chestovich PJ, Saroukhanoff RZ, Moujaes SF, et al. Temperature Profiles of Sunlight-Exposed Surfaces in a Desert Climate: Determining the Risk for Pavement Burns. J Burn Care Res. 2022 Sep 26;44(2):438‑445. https://pmc.ncbi.nlm.nih.gov/articles/PMC10211493/
- Cottony HV, Dill RS. Solar heating of various surfaces. 1941. https://doi.org/10.6028/nbs.bms.64
- National Oceanic and Atmospheric Administration. Learning Lesson: Canned Heat. https://www.noaa.gov/jetstream/ll-canned-heat