Weather influences everything from the clothes we wear to the games we play outside. By keeping a simple weather journal, children can see how clouds, temperature, and rain are connected over time. This observation‑based project uses everyday items, requires no special equipment, and fits comfortably into a family’s daily routine.
Overview
In this activity students become junior meteorologists. They will:
- Record temperature three times a day with a basic thermometer.
- Identify cloud types using a printable chart.
- Measure rainfall with a small rain gauge.
- Draw the sky and note wind direction.
- Look for patterns that explain why certain clouds bring rain.
The project is an Observation activity suitable for beginners (ages 6‑14) and aligns with elementary earth‑science standards about collecting and interpreting data.
Before You Begin
- Choose a consistent spot. Place the rain gauge on level ground, away from trees or roofs that could funnel extra water.
- Safety first. Use an alcohol thermometer (no mercury) and handle any glass jars with adult supervision. Never look directly at the sun while observing the sky.1
- Set a schedule. Decide on three observation times—morning (e.g., 8 am), noon (12 pm), and evening (6 pm). Record the same times each day for reliable comparison.
Materials
- Notebook or several sheets of plain paper (for the journal).
- Pencil or pen.
- Alcohol thermometer (readable in °C or °F).
- Small straight‑sided plastic container about 2 inches in diameter (e.g., a clean peanut‑butter jar) to serve as a rain gauge.1
- Ruler (to measure water depth in the gauge).
- Printable cloud‑identification chart (cirrus, cumulus, stratus, nimbus, etc.).
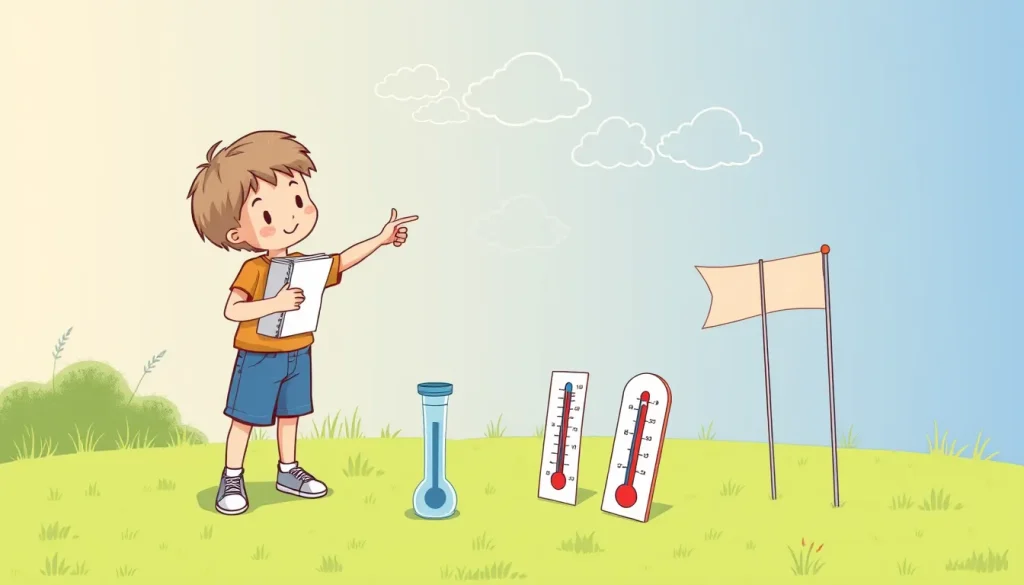
- Optional: a wind‑direction indicator such as a simple flag attached to a stick.
Steps
- Prepare the journal. Turn to a fresh page for each day. Write the date at the top and draw a small table with columns for Time, Temperature, Cloud Type, Precipitation, Wind, and a sketch space.
- Set up the rain gauge. Place the container on a flat surface outdoors where it will not be disturbed. Mark the rim with a permanent pen for reference.
- Morning observation. At the chosen morning time, record the temperature, look up and identify the dominant cloud type, note any rain on the ground, and sketch the sky.
- Noon observation. Repeat the same steps around noon. If rain has fallen since the morning, measure the water depth in the gauge with a ruler (record in millimetres or inches).
- Evening observation. Perform the final daily check. Add any new precipitation to the gauge reading, and note wind direction (e.g., using a simple arrow drawn on the page).
- Repeat for two weeks. Consistency is key; aim for at least 14 days of data to see short‑term patterns.
- Review your data. After the observation period, compare temperature trends with cloud types and rainfall. Look for relationships such as “cumulus clouds often appear when temperatures rise” or “nimbus clouds precede rain.”
What to Observe and Measure
Qualitative observations include cloud shape (cirrus, cumulus, stratus, nimbus), sky colour, and wind direction. Use the cloud chart to tick the appropriate box.
Quantitative measurements are:
- Temperature: read the thermometer and write the value with its unit.
- Rainfall: measure the depth of water in the gauge. Convert the depth to millimetres (1 mm = 0.039 in). If you prefer a volume measurement, use the formula depth = volume ÷ (π r²), where r is the radius of the container.
- Wind direction: draw an arrow on the sketch indicating the direction the wind is blowing from.
Observation Journal Template
| Date | Time | Temp (°C/°F) | Cloud Type | Precip (mm/in) | Wind | Sketch |
|---|---|---|---|---|---|---|
| (Draw sky, clouds, and any notable features) | ||||||
Feel free to add extra columns for humidity, barometric pressure, or any other phenomenon you wish to track.
The Science Explained
Clouds form when moist air rises, cools, and condenses into tiny water droplets or ice crystals. The shape of a cloud tells you about the air’s stability:
- Cirrus – thin, wispy clouds high in the sky; indicate dry, stable air.
- Cumulus – fluffy, cotton‑like clouds; often grow when warm air rises, signaling possible afternoon heating.
- Stratus – uniform, gray layers; form when a gentle lift spreads moisture over a large area, often leading to drizzle.
- Nimbus (especially cumulonimbus) – tall, dark clouds; the presence of a nimbus cloud usually means the air is very unstable and rain or thunderstorms are likely.
Temperature influences how much water vapor the air can hold. Warm air can hold more moisture, so a rise in temperature often precedes cloud development. When the air cools enough for the water droplets to become heavy, they fall as precipitation. A rain gauge simply collects this water, allowing you to quantify how much fell.
By comparing the three data sets—temperature, cloud type, and rainfall—you can see the cause‑and‑effect chain that meteorologists use to forecast short‑term weather.
Troubleshooting
- Thermometer reads oddly high or low. Check that the thermometer is not in direct sunlight or near a heat‑producing object. Allow it to equilibrate for a minute before reading.
- Rain gauge shows unexpected numbers. Make sure the gauge is level; tilt can cause water to pool on one side and give a false depth. Rinse the gauge each morning to avoid residual water.
- Cloud identification is confusing. Use the printable chart as a reference and start by noting the most obvious feature (e.g., “thin wisps” for cirrus). Over time, patterns become easier to recognize.
- Wind direction changes quickly. Record the direction you feel at the moment of observation; a brief note like “gusty from the west” is sufficient.
Next Steps
Once the two‑week journal is complete, consider these extensions:
- Graph temperature. Plot morning, noon, and evening temperatures on a line graph to visualize daily cycles.
- Cloud‑rain correlation. Create a bar chart showing how many days each cloud type was followed by measurable rain.
- Make a forecast. Using the patterns you discovered, write a short weather forecast for the next day and compare it with the official forecast.
- Share findings. Present your journal and graphs to family, a classroom, or a homeschool group. Explain how the data support your conclusions.
Continuing the journal through a full season (spring, summer, fall, or winter) will reveal larger climate trends and deepen understanding of the water cycle.
Frequently asked questions
How often should I record the weather?
Record three times each day—morning, noon, and evening—at the same clock times throughout the observation period. Consistency lets you compare temperature swings and cloud changes accurately.
Do I need a professional thermometer?
No. An inexpensive alcohol thermometer works well for classroom and home use. Avoid mercury thermometers and never place the thermometer in direct sunlight.
Can I use a plastic bottle instead of a jar for the rain gauge?
Yes, as long as the opening is about 2 inches in diameter and the container sits level. Mark the height on the side so you can read the water depth.
Related terms
- Cloud
- A visible collection of tiny water droplets or ice crystals suspended in the atmosphere.
- Precipitation
- Any form of water—rain, snow, sleet, or hail—that falls from clouds to the ground.
- Temperature
- A measure of how hot or cold the air is, usually expressed in degrees Celsius or Fahrenheit.
Sources & references
- Look Up! Observing Weather – Earth Science Week, https://www.earthsciweek.org/resources/classroom-activities/ncli-look-up-observing-weather/
- My Weather Journal – Education Recoded, https://educationrecoded.org/wp-content/uploads/2025/03/Weather-Journal.pdf
- Science Journal: Keeping a Weather Log – Education World, https://www.educationworld.com/a_lesson/science-journal-keeping-weather-log