Overview
Soil temperature influences plant growth, water evaporation, and even the activity of soil microbes. One of the most obvious factors that changes soil temperature is shade – whether it comes from trees, hedgerows, or a simple cardboard panel. In this experiment children will compare the temperature of soil that receives direct sunlight with soil that is partially shaded, using only everyday materials.
Testable Question
Does a shade cover lower the temperature of soil compared with an unshaded area?
Hypothesis
Because shade blocks solar radiation, the shaded soil will stay cooler than the soil in full sun. We predict a temperature difference of at least 2 °C during the warmest part of the day.
Materials
- Two identical plant pots (≈15 cm diameter) filled with the same amount of garden soil.
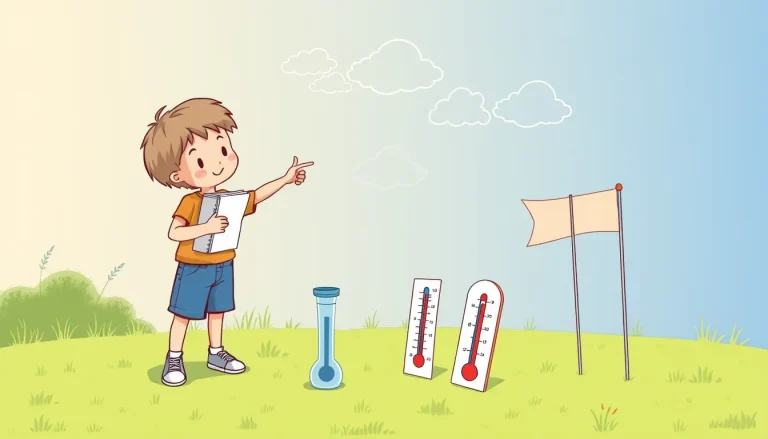
- Two garden‑type thermometers that can read at least –10 °C to 50 °C (digital or dial).
- One piece of cardboard (about 30 × 30 cm) or a shade cloth to act as a shade card.
- Ruler or measuring tape.
- Notebook or printable data table (paper).
- Optional: small shovel, water can for moistening soil.
Before You Begin
- Choose a sunny day when the sky is clear for at least three hours (mid‑morning to early afternoon works well).
- Place the two pots side‑by‑side on a level spot of bare ground or a patio. Make sure they receive the same amount of sunlight.
- Label one pot “Sunny” and the other “Shaded”.
- Insert each thermometer into the soil so that the sensor tip is about 5 cm below the surface – the same depth in both pots.
- Secure the cardboard shade card about 30 cm above the soil in the “Shaded” pot, covering roughly two‑thirds of the pot’s top surface. The cardboard should be angled to receive the sun but block direct rays from reaching the soil.
- Leave the “Sunny” pot uncovered.
Procedure (Steps)
- At the start of the observation period (e.g., 09:00 AM), record the ambient air temperature, the soil temperature in each pot, and the cloud cover (clear, partly cloudy, overcast).
- Every 30 minutes, record the soil temperature from both thermometers. Continue for at least four hours, capturing the time when the sun is highest.
- If possible, repeat the same observation on a second day with similar weather to see how consistent the effect is.
- After the final reading, remove the shade card, rinse the thermometers, and store them for future use.
Variables and Controls
- Independent variable: Presence of shade (shaded vs. unshaded).
- Dependent variable: Soil temperature (°C) measured at 5 cm depth.
- Controlled variables: Soil type, pot size, soil moisture (keep both pots equally moist before starting), thermometer model, measurement depth, observation times, and location.
- Control group: The “Sunny” pot serves as the control, representing the natural, unshaded condition.
Repeated Trials
Each 30‑minute reading is a trial. To assess natural variability, aim for at least three full observation sessions on different days (e.g., three sunny mornings). Consistent results across days strengthen the conclusion.
What to Observe or Measure
- Soil temperature (°C) for each pot at each time point.
- Time of day (HH:MM).
- Weather notes (cloud cover, wind).
Data Table
| Date | Time | Ambient Air Temp (°C) | Sunny Soil Temp (°C) | Shaded Soil Temp (°C) | Cloud Cover |
|---|---|---|---|---|---|
Graphing Your Results
Plot a line graph with time of day on the horizontal axis and soil temperature on the vertical axis. Draw two lines – one for the sunny pot and one for the shaded pot. The vertical distance between the lines shows the cooling effect of shade. A simple spreadsheet or free graphing tool can be used.
The Science Explained
Sunlight carries energy in the form of visible and infrared radiation. When sunlight reaches bare soil, the surface absorbs this energy, warming the upper layers. Heat then conducts downward, raising the temperature at 5 cm depth.
Shade blocks a portion of the incoming radiation. In forest research, shelterwood (partial canopy) reduced soil temperature by about 6 K (≈6 °C) compared with clear‑cut sites, even at depths of 20 cm and 320 mm [3](https://doi.org/10.2136/sssaj1985.03615995004900040046x). Similar effects have been measured for hedgerows and other vegetation, where shaded soils stay several degrees cooler than adjacent sunny soils [4](https://doi.org/10.18690/agricsci.20.2.1). The reduction occurs because less solar energy reaches the soil surface, and the shade also reduces the rate of heat loss at night, creating a more stable temperature regime.
In the experiment, the cardboard shade card mimics a thin canopy. It allows some diffuse light through but blocks direct rays, producing a measurable temperature gap. The size of the gap depends on the shade density, the angle of the sun, and soil properties such as moisture (wet soil heats more slowly because water has a high heat capacity).
Troubleshooting
- Thermometer readings jump erratically: Make sure the sensor tip is fully buried at the same depth and that the soil is not overly compacted around it.
- Temperatures are identical: Check that the shade card truly blocks direct sun; reposition it if the sun is hitting the side of the pot.
- One pot dries out faster: Lightly water both pots to the same moisture level before each observation session.
- Wind causes rapid cooling: Place the pots in a relatively sheltered spot, or note wind speed as an additional observation.
Cleanup and Disposal
After the experiment, rinse the thermometers with water and store them in a dry place. The cardboard shade card can be reused for future investigations or recycled. Soil can be returned to the garden or composted.
Next Steps
Kids can extend the project by:
- Testing different shade materials (e.g., cloth, leaves, newspaper) and noting how the amount of shade influences temperature.
- Measuring soil moisture alongside temperature to see the combined effect of shade and water retention.
- Exploring deeper soil layers (10 cm, 15 cm) to see how far the cooling effect penetrates.
These extensions reinforce the idea that multiple environmental factors work together to shape the soil environment.
Frequently asked questions
How often should I record the temperature?
A 30‑minute interval provides enough detail to see the warming and cooling pattern without being too time‑intensive. You can adjust to 15‑minute intervals if you want more data.
Can I use a smartphone temperature sensor instead of a thermometer?
Smartphone sensors are not calibrated for soil temperature and can be inaccurate. A simple garden or probe thermometer gives reliable, repeatable readings.
Related terms
- Soil temperature
- The measure of how warm or cool the soil is, typically recorded at a specific depth below the surface.
- Shade
- Any object or material that blocks direct sunlight, reducing the amount of solar energy that reaches a surface.
- Heat flux
- The flow of thermal energy into or out of the soil, driven by differences in temperature.
Sources & references
- Effect of vegetation shade on soil temperature, AgEcon Search, University of Minnesota, 2023-01-01, https://doi.org/10.22004/ag.econ.345050
- Shadecard and Shelterwood Modification of the Soil Temperature Environment, Soil Science Society of America Journal, 1985-07-01, https://doi.org/10.2136/sssaj1985.03615995004900040046x
- The Effects of Hedgerows Shading on Soil Temperature and Gravimetric Soil Water Content, Agricultura Scientia, 2023-11-10, https://doi.org/10.18690/agricsci.20.2.1