Evaporation is the process by which a liquid turns into a gas and mixes with the surrounding air. When the surface of the water is exposed, molecules that have enough energy can escape into the atmosphere. Covering the surface blocks many of those molecules, so the water disappears more slowly. This experiment lets learners see the effect of a cover in a concrete, visual way.
Orientation
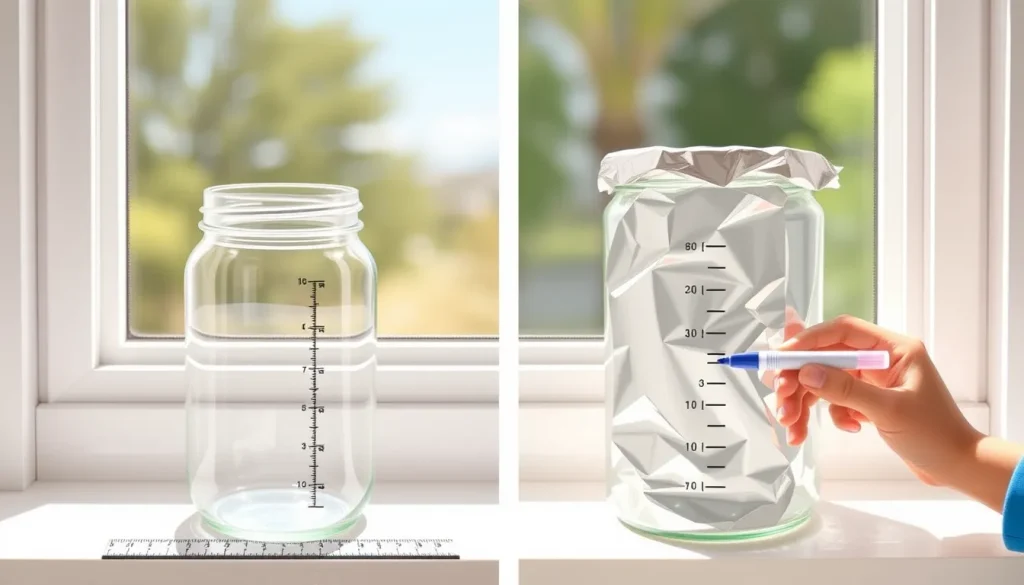
In this activity you will set up two identical containers of water: one left open to the air and one sealed with a tight foil lid. Over several days you will record how much water each loses. The difference demonstrates how a simple cover can dramatically reduce the rate of evaporation.
Before You Begin
- Choose a sunny, outdoor spot where the two jars will receive the same amount of sunlight and wind.
- Plan for daily observations over at least five days. A notebook or printable observation journal will help keep records tidy.
- Adult supervision is needed for handling hot water (if you choose to warm the water) and for securing the foil lid.
Materials
- 2 identical glass or plastic jars (e.g., mason jars, 250 ml each) – same shape and size.
- Tap water – enough to fill each jar about halfway (≈120 ml).
- Aluminum foil (or a piece of cardboard with a tight seal) for the cover.
- Permanent marker – to mark the initial water level.
- Ruler or measuring tape – to measure water height in centimeters.
- Notebook, worksheet, or printed data table.
- Sunny outdoor location with minimal shade differences.
Steps
- Clean the two jars and let them dry.
- Fill each jar with the same amount of water (about halfway). Use the ruler to check that the water height is the same in both.
- With the marker, draw a line on the outside of each jar at the water surface level – this is your Day 0 reference.
- Cover one jar tightly with a sheet of aluminum foil, pressing the edges so no air can easily flow underneath. If you use cardboard, tape the edges securely.
- Label the jars “Covered” and “Uncovered.”
- Place both jars side by side in the chosen sunny spot. Make sure they receive the same amount of direct sunlight and wind.
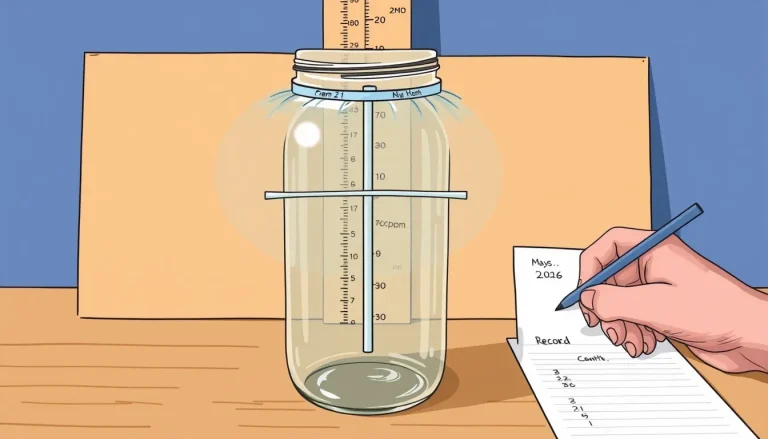
- At the same time each day (e.g., 9 am), observe the water level. Use the ruler to measure the height from the bottom of the jar to the water surface and record the value in the data table.
- Repeat the measurement for at least five consecutive days. If possible, continue for a week to see a clearer trend.
- After the observation period, remove the foil and safely dispose of any leftover water.
What to Observe or Measure
Record the water height (in centimeters) for each jar every day. The key measurement is the change in height from Day 0 to each subsequent day. A larger drop in the uncovered jar indicates a faster evaporation rate.
Testable Question
Does covering a water container with foil reduce the rate of water loss compared with an uncovered container under the same environmental conditions?

Hypothesis
Because the foil blocks the water surface, the covered jar will lose less water each day than the uncovered jar. In other words, the evaporation rate of the covered jar will be slower.
Variables and Controls
- Independent variable: Presence of a cover (covered vs. uncovered).
- Dependent variable: Amount of water lost, expressed as change in water height (cm) per day.
- Controlled variables: Size and shape of jars, initial water volume, outdoor location, sunlight exposure, ambient temperature, wind exposure, measurement time each day.
Repeated Trials
To increase confidence in the result, you can set up additional pairs of jars and repeat the same procedure. Each pair counts as a trial. Comparing the data across trials shows natural variation and helps students understand experimental repeatability.
Data Table
| Day | Uncovered (cm) | Covered (cm) |
|---|---|---|
| 0 | ||
| 1 | ||
| 2 | ||
| 3 | ||
| 4 | ||
| 5 |
Graphing Your Results
Plot a line graph with Day on the horizontal axis and Water height (cm) on the vertical axis. Draw two lines – one for the uncovered jar and one for the covered jar. The slope of each line represents the evaporation rate; the shallower slope of the covered line visualizes the slower loss of water.
The Science Explained
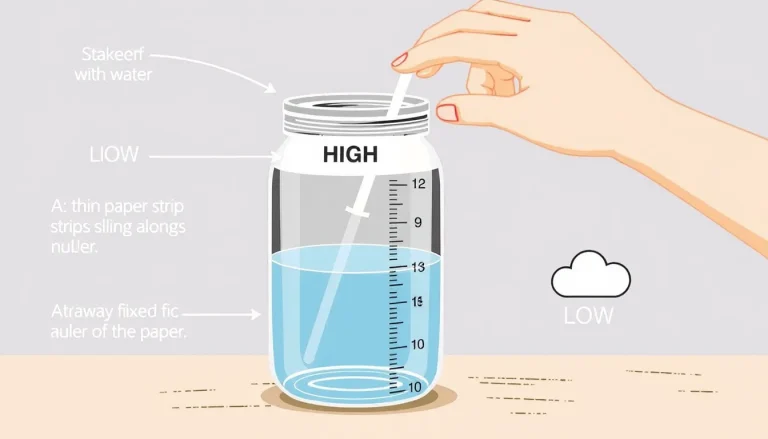
Evaporation occurs when water molecules at the surface gain enough kinetic energy to break free and become water vapor. The rate depends on temperature, surface area, airflow, and humidity. A cover reduces the exposed surface area to essentially zero, and it also traps a thin layer of humid air above the water, which lowers the gradient that drives further evaporation. This is why the covered jar retains water longer.
In the natural world, clouds act as a “cover” for bodies of water, slowing evaporation, while wind and open surfaces accelerate it. Understanding how simple barriers affect evaporation helps explain processes such as water storage, cooling, and even cooking techniques like covering a pot to retain moisture.
Troubleshooting
- No noticeable difference after several days: The weather may be very humid, which already slows evaporation. Try the experiment on a drier, warmer day.
- Foil tears or lifts: Secure the edges with tape or use a heavier piece of cardboard.
- Water level measurements jump erratically: Ensure the ruler is placed at the same spot each day and that the jar is on a level surface.
Cleanup and Disposal
When the observation period ends, pour any remaining water down the sink. Rinse the jars and let them dry. Aluminum foil can be recycled if clean; cardboard can be composted or recycled as well.
Next Steps
Students can extend the investigation by changing one factor at a time: try different cover materials (plastic wrap, glass lid), vary the size of the opening, or compare evaporation in shade versus direct sun. Each modification becomes a new experiment that deepens understanding of the variables that control evaporation.
Sources & references
- Experiment With Covered and Uncovered Jars, St Nicholas New Romney School, https://www.st-nicholas-newromney.kent.sch.uk/wp-content/uploads/2020/04/Evaporation-and-codensation-Experiments.pdf
- Evaporation activity instructions, Funology, https://www.funology.com/evaporation/
- Simple Evaporation Experiments, Sciencing, https://www.sciencing.com/simple-evaporation-experiments-15764/