Overview
A barometer is an instrument that measures atmospheric pressure – the weight of the air above us. High pressure usually brings clear skies, while low pressure often precedes clouds, wind, and rain. By building a barometer from a jar, a balloon, a straw and a piece of cardboard, children can see pressure changes in real time and connect them to everyday weather forecasts.
Before You Begin
- Choose a stable work surface where the jar will not be knocked over.
- Gather all materials before starting; the activity takes about 30 minutes of hands‑on time, then several days of observation.
- Adult supervision is recommended for cutting the balloon and handling scissors.
- Make sure the room temperature is moderate (15‑25 °C) so the balloon does not become too stiff or too stretchy.
Materials
- One small glass jar or clean tin can (about 8–12 cm tall) – the container that holds the air.
- One fresh latex balloon (never used) – it will act as a flexible membrane.
- Rubber band(s) – to secure the balloon to the jar opening.
- Two drinking straws (plastic, about 15 cm long) – one becomes the pointer, the other can be used as a spacer if needed.
- Two pieces of cardstock or sturdy paper (≈10 cm × 15 cm) – one for a scale, one for recording.
- Adhesive tape or a small amount of glue.
- Ruler and a pen or pencil for marking.
All of these items are commonly found at home or in a classroom supply cabinet. If a latex balloon is unavailable, a piece of clear plastic wrap can be used, but the balloon gives a more responsive membrane.
Steps (Build the Barometer)
- Prepare the balloon. Cut off the narrow neck of the balloon so you have a flat circular sheet of rubber.4
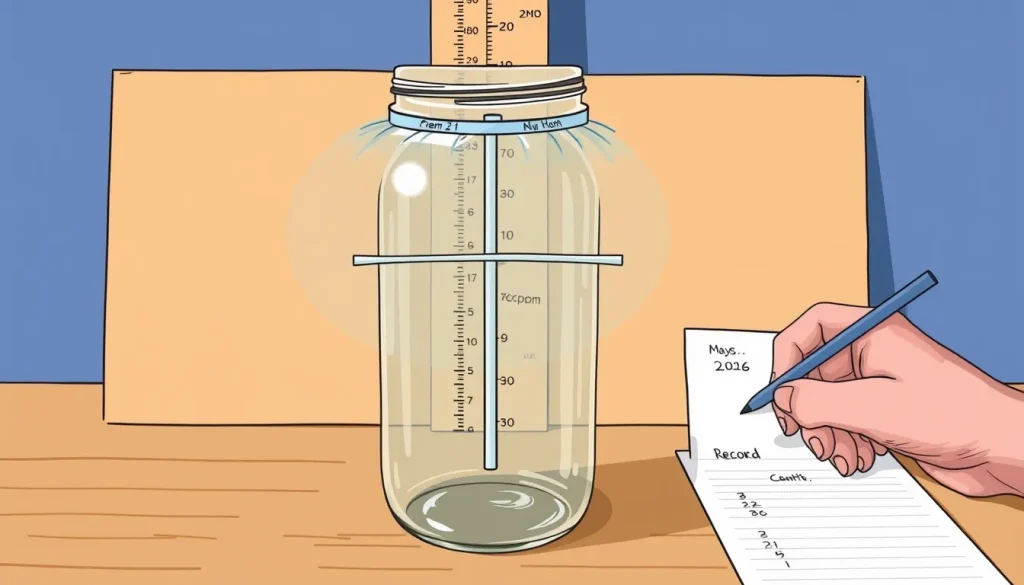
- Seal the jar. Stretch the cut balloon tightly over the mouth of the jar, making sure there are no gaps. Secure it with a rubber band so the surface is airtight.4
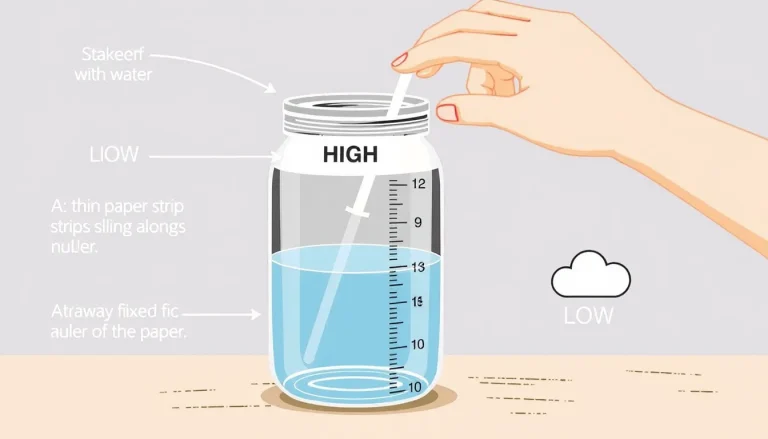
- Attach the pointer. Tape one end of a drinking straw to the center of the stretched balloon membrane so the straw points outward, away from the jar. The straw should be free to pivot up and down.
- If the straw wobbles, add a small piece of tape underneath to keep it steady.
- Make a scale. On a piece of cardstock, draw a vertical line and mark evenly spaced increments (e.g., every 1 cm). Label the line “0 cm” where the straw currently points.
- Place the cardstock vertically on a wall directly behind the jar and tape it in place.
- Record the initial position. Note the exact point where the straw’s tip meets the scale. This is your baseline (day 0) reading.
- Write the date and time on the same cardstock.
- Begin daily observations. Each day, at the same time (e.g., 8 am), look at the straw and record the new position on the scale. Also note the day’s weather forecast (high pressure / low pressure) and what you actually observe outside (clear, cloudy, rain, wind).
What to Observe or Measure
- Pointer height. Measure the distance (in centimeters) from the baseline mark to the current tip of the straw.
- Weather condition. Record the forecasted pressure trend (high or low) and the actual sky condition.
These two pieces of data let you compare the barometer’s response to real‑world pressure changes.
Testable Question
Does the straw pointer rise on days when the forecast predicts high atmospheric pressure and fall on days when low pressure is forecast?

Hypothesis
If atmospheric pressure is high, the air pushes down on the balloon membrane, flattening it and causing the straw to point upward. Conversely, if pressure drops, the membrane bulges outward and the straw points downward.
Variables and Controls
- Independent variable: The atmospheric pressure condition (high vs. low) as indicated by the weather forecast.
- Dependent variable: The pointer position measured in centimeters.
- Controlled variables: Same jar, same balloon, same straw length, same room temperature, same recording time each day, and the same scale on the cardstock.
Repeated Trials
To obtain reliable results, repeat the observation for at least one full week (seven days) and, if possible, for two weeks. Consistency in timing and recording method reduces random error.
Data Table (Blank)
| Date | Time | Forecast Pressure | Pointer Reading (cm) | Observed Weather |
|---|---|---|---|---|
Graphing Your Results
Plot the pointer reading (y‑axis, cm) against the day number (x‑axis). Use a different colour or symbol to mark days with a high‑pressure forecast versus low‑pressure forecast. A trend of higher points on high‑pressure days supports the hypothesis.
The Science Explained
Atmospheric pressure is the weight of the column of air above Earth’s surface. At sea level the average pressure is about 1 atmosphere (≈1013 millibars) and it decreases with altitude.1 When the pressure rises, more air pushes down on the balloon membrane, flattening it. The attached straw, which pivates at the membrane, is forced upward. When pressure falls, the membrane bulges outward, allowing the straw to drop. This simple mechanical linkage converts an invisible force (air weight) into a visible movement.
The barometer does not give an exact pressure value in millibars, but the direction and magnitude of movement correlate with real‑world pressure changes. For precise measurements, professional barometers use sealed aneroid capsules or mercury columns, but the balloon model is an excellent visual model for learners.
Troubleshooting
- Pointer does not move. Check that the balloon seal is airtight; any leak will equalize pressure and stop movement.
- Straw wobbles too much. Reinforce the tape joint or use a shorter, lighter straw.
- Scale marks are hard to read. Use a ruler to draw more precise intervals and label each mark.
Cleanup and Storage
When the observation period ends, remove the straw and balloon. The jar can be reused for future experiments. Balloon pieces can be disposed of in regular waste; no hazardous chemicals are involved.
Next Steps
- Calibrate the barometer by comparing its readings with a local weather station’s reported pressure (in millibars) and create a conversion chart.
- Try adding a second straw on the opposite side of the balloon to create a double‑pointer system for greater stability.
- Explore how temperature affects the balloon’s elasticity by recording readings at different times of day.
With a simple homemade barometer, children gain hands‑on experience with atmospheric science and learn how scientists collect data to forecast the weather.
Related terms
- Atmospheric pressure
- The force exerted by the weight of air above a given point, usually measured in millibars or kilopascals.
- Barometer
- An instrument that detects changes in atmospheric pressure, often used to predict weather.
- Hypothesis
- A testable prediction about how a change in one variable will affect another.
Sources & references
- Make Your Own Barometer - U.S. National Park Service. https://www.nps.gov/teachers/classrooms/make-your-own-barometer.htm
- Make a barometer – Met Office PDF. https://www.metoffice.gov.uk/binaries/content/assets/metofficegovuk/pdf/weather/learn-about/met-office-for-schools/diy-activities/make-a-barometer-diy-activity.pdf
- How to Build a Barometer That Measures Millibars. https://www.htfbw.com/science-nature/Nature/56125.shtml
- South Carolina State Climatology Office – How to Make a Barometer. https://www.dnr.sc.gov/climate/sco/Education/barometer.php