Orientation
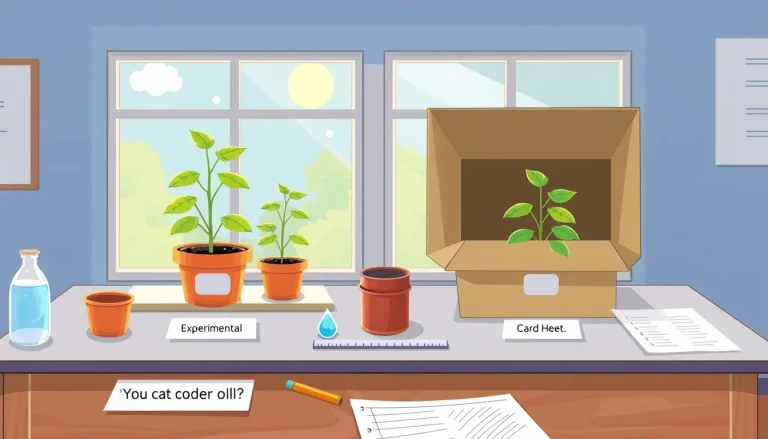
When children watch a seed sprout, they are seeing a living experiment in real time. To turn those observations into scientific knowledge, the data must be recorded in a way that is easy to read, compare, and analyse. A well‑structured table does exactly that: it shows what was measured, how it was measured, and under which conditions. This article walks you through the whole workflow – from preparing the worksheet to creating a simple bar graph – using only everyday materials such as paper, pencils, and a kitchen ruler.
Before You Begin
- Age suitability: The core ideas work for ages 6‑14; younger children can focus on drawing pictures, while older learners can add calculations and graphs.
- Workspace: A flat surface with good lighting. Keep a notebook or a printable worksheet nearby for each plant.
- Adult role: Help younger children label columns, check that units are consistent, and supervise any use of scissors or measuring tools.
- Time plan: Set up the experiment in 15‑20 minutes, then observe daily for 1‑2 weeks. Data entry takes only a few minutes each day.
Materials
- Seeds (e.g., beans, cress, or radish) – at least three per treatment.
- Small planting containers (paper cups, recycled yogurt pots, or seed‑starting trays).
- Potting mix or cotton wool for germination.
- Watering source (cup or spray bottle).
- Ruler or measuring tape (centimetres preferred).
- Plain paper or a printable data‑table worksheet (see the blank table below).
- Pencil, eraser, coloured pens (optional for colour‑coding).
- Computer with spreadsheet software (optional for graphing).
Steps – Setting Up the Experiment
- Label each plant. Write a unique number on the pot (e.g., P1, P2, …) and note its treatment (e.g., “Full Sun”, “Shade”, “No Water”).
- Plant the seeds. Place the same number of seeds in each pot, cover lightly with soil, and water gently.
- Record the start date. Write the calendar date in the first column of your table.
- This creates a reference point for all later measurements.
- Establish the observation schedule. Decide on a consistent time each day (e.g., 9 am) to measure growth.
- Consistency reduces variation caused by diurnal changes.
- Measure and record. Using the ruler, measure the length of the tallest shoot from the soil surface to the tip. Write the value in centimetres in the appropriate row.
- If a plant has not yet germinated, record “0” or “–” to indicate no growth.
- Repeat daily. Continue the same measurement each day for the chosen observation period (usually 7‑14 days).
What to Observe or Measure
The primary quantitative variable in most seed‑growth projects is shoot length (cm). Qualitative notes are also valuable – colour of leaves, number of leaves, or any wilting. Record these in separate columns so that you can later decide whether to treat them as numbers or categories.
The Science Explained
Plants grow by converting light, water, and nutrients into new cells through photosynthesis. When you change one factor – for example, the amount of sunlight – you create a condition that may speed up or slow down that conversion process. By measuring shoot length over time, you are quantifying how quickly the plant is building new tissue. The pattern you see in the table (steady increase, plateau, or decline) reflects the underlying biological processes and any stressors you introduced.
Variables and Controls
- Independent variable (the factor you change): light exposure, water amount, soil type, etc.
- Dependent variable (what you measure): shoot length (cm) and optional qualitative notes.
- Controlled variables (kept the same): seed type, pot size, soil depth, temperature, and measurement time of day.
- Control group: A set of plants that receive the standard condition (e.g., full sunlight and regular watering) so you can compare any treatment effects against a baseline.
Clearly stating these in the table header helps children understand the experimental design and prevents accidental changes.
Repeated Trials
Each pot represents a trial of the treatment. Having at least three replicates per treatment lets you see natural variation and calculate an average. When you later compute the mean shoot length for each day, the variation among replicates tells you how reliable the pattern is.
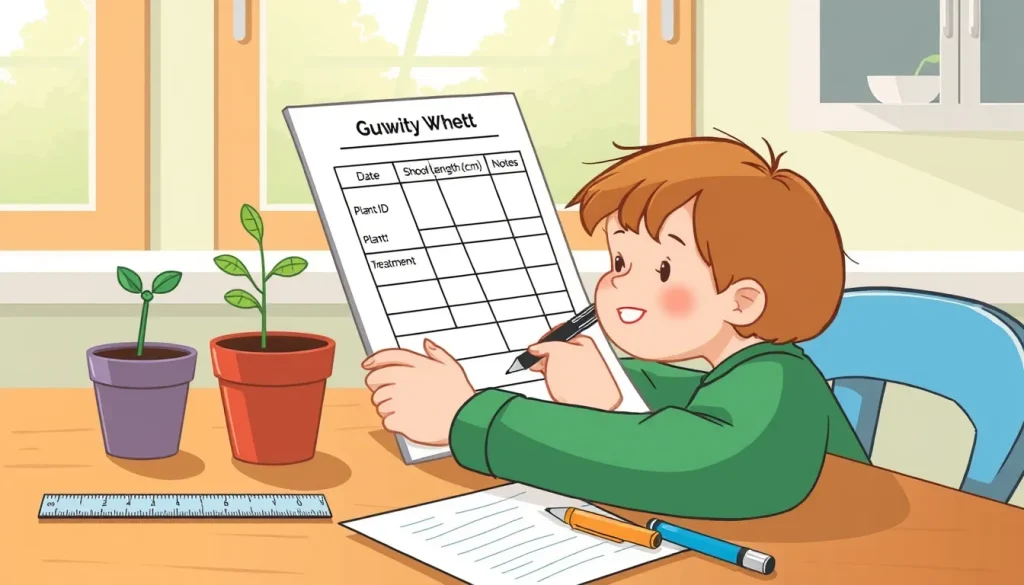
Data Table – Blank Template
| Date (dd/mm/yy) | Plant ID | Treatment | Shoot Length (cm) | Notes (colour, leaf count, wilting?) |
|---|
Leave the cells empty when you print; fill them in each day. Use consistent units (centimetres) and abbreviations (e.g., “wt” for wilted) to keep the table tidy.
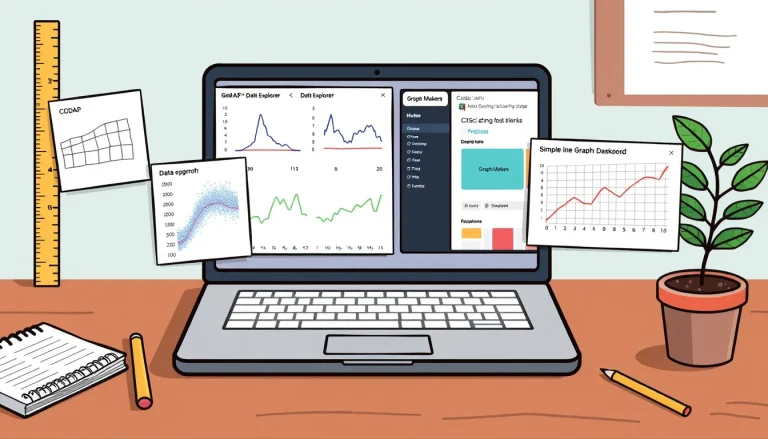
Graphing Your Results
Once you have a week of data, a simple bar graph or line graph shows the growth trend. Follow these guidelines:
- X‑axis: Days since planting (or date).
- Y‑axis: Average shoot length (cm) for each treatment.
- Bars or lines: Use a different colour for each treatment; include a legend.
- Error bars (optional): Show the range (minimum‑maximum) or standard deviation if you have calculated it.
Spreadsheet programs automatically create these graphs; for a paper‑only approach, draw a grid on graph paper and plot the points by hand. The visual comparison makes it easy to answer questions such as “Which light condition produced the tallest plants?”
Troubleshooting Common Issues
| Problem | Possible Cause | Suggested Fix |
|---|---|---|
| Values missing for some days | Forgot to measure at the scheduled time | Mark the missed day with “—” and note the reason; continue next day |
| Inconsistent units (cm vs. mm) | Different children used different rulers | Standardise the ruler before the first measurement; convert any outliers |
| Plants die early | Over‑watering or insufficient light | Adjust watering schedule; relocate pots to the intended light level |
| Table becomes crowded | Too many columns or notes in the same cell | Use separate columns for quantitative and qualitative data; keep notes brief |
Worked Example
Imagine a three‑day snapshot for two treatments – Full Sun (FS) and Shade (SH) – with three replicates each.
| Date | Plant ID | Treatment | Shoot Length (cm) |
|---|---|---|---|
| 01/09 | P1 | FS | 0 |
| 01/09 | P2 | FS | 0 |
| 01/09 | P3 | FS | 0 |
| 01/09 | P4 | SH | 0 |
| 01/09 | P5 | SH | 0 |
| 01/09 | P6 | SH | 0 |
| 03/09 | P1 | FS | 2.5 |
| 03/09 | P2 | FS | 2.8 |
| 03/09 | P3 | FS | 2.6 |
| 03/09 | P4 | SH | 1.1 |
| 03/09 | P5 | SH | 1.0 |
| 03/09 | P6 | SH | 0.9 |
Average length on Day 3: Full Sun = (2.5+2.8+2.6)/3 ≈ 2.6 cm; Shade = (1.1+1.0+0.9)/3 ≈ 1.0 cm. A simple bar graph would clearly show the Sun‑treated plants grew more than twice as fast.
Next Steps
- Calculate the growth rate (cm per day) for each treatment.
- Introduce a third variable, such as fertilizer, and repeat the table‑making process.
- Use the data to write a short report: state the question, hypothesis, method, results (table + graph), and conclusion.
With practice, children develop the habit of organising data before they think about conclusions – a cornerstone of scientific reasoning.
FAQ
Do I need a computer to make a data table?
No. A paper worksheet works perfectly, and the table can later be entered into a spreadsheet if you want to create a graph.
What if my plants grow at different speeds?
That variation is normal. Record each plant separately, then calculate the average for each treatment; the spread tells you how consistent the effect is.
Can I use inches instead of centimetres?
Yes, but keep the same unit for every measurement and note the unit in the column heading.
How many days should I observe?
Most fast‑germinating seeds show clear differences within 7‑14 days. Longer observations are fine for slower‑growing plants.
Related terms
- Variable
- A factor that can change in an experiment; it may be deliberately altered (independent) or measured (dependent).
- Control group
- A set of plants that receive the standard conditions, used as a baseline for comparison.
- Trial
- One individual plant or repeat of the same treatment; multiple trials improve reliability.
- Observation
- A careful note of what you see, which can be qualitative (colour) or quantitative (length).