Overview
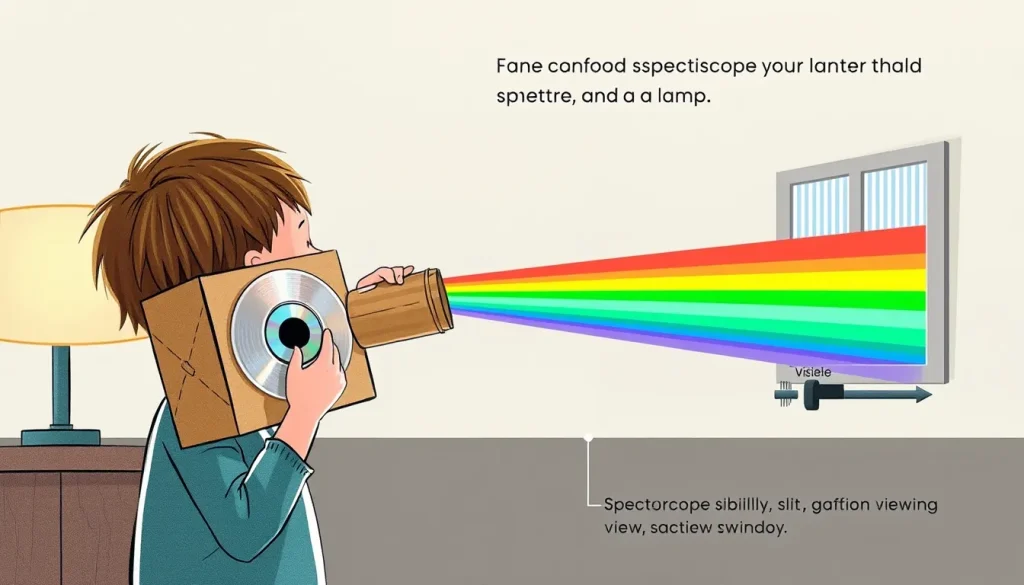
This experiment lets kids construct a functional spectroscope using only cardboard, tape, and a piece of a CD or DVD. Once assembled, the spectroscope splits white light into a rainbow of colours, letting children compare the spectra produced by different light sources such as sunlight, incandescent bulbs, LEDs, and fluorescent tubes.[1]
Before You Begin
- Adult supervision: Children under 12 should be guided when cutting cardboard and handling a craft knife.
- Safety with light: Never point the spectroscope directly at the sun. Use reflected sunlight on a wall or test indoor light sources only.[1]
- Workspace: A clean table with a scrap of newspaper for debris and a trash bin for scraps.
Materials
- One large cardboard box or a sturdy cardboard tube (about 30 cm long).
- One unused CD or DVD (the shiny side will act as a diffraction grating).[3]
- Scissors or a craft knife.
- Black electrical tape or masking tape.
- Glue or double‑sided tape.
- Ruler.
- Permanent marker (for labeling).
Steps – Building the Spectroscope
- Prepare the box: If using a cardboard box, cut off one of the larger ends so you have an open tube about 30 cm long. Reinforce the edges with tape.
- Attach the CD: Cut a small rectangular opening (≈2 cm × 2 cm) in the middle of one side of the tube. Tape the CD inside the tube so that the shiny, reflective side faces outward and the disc lies flat against the wall of the tube. The CD should be positioned close to the opening but not covering it.[4]
- Create the viewing slit: On the opposite side of the tube, cut a narrow vertical slit about 1 mm wide and 5 mm tall. This slit will let a thin beam of light enter the CD grating.
- Make the observation window: Cut a larger rectangular window (≈2 cm × 5 cm) on the side of the tube directly opposite the CD. This is where you will look through to see the spectrum.
- Seal the tube: Use black tape to cover any gaps or extra holes so that stray light does not enter the tube.
- Label the device: Write your name and the date on the outside for record‑keeping.
Testable Question
Do different light sources produce noticeably different colour spectra when viewed through the same cardboard spectroscope?
Hypothesis
Because each light source emits a distinct mixture of wavelengths, the spectroscope will show a richer, more continuous rainbow for sunlight and incandescent bulbs, while LEDs and fluorescent lights will display fewer, more discrete colour bands.
Variables and Controls
- Independent variable: Type of light source (sunlight, incandescent bulb, LED flashlight, fluorescent lamp).
- Dependent variable: Observed colour pattern (number of distinct bands, colour intensity).
- Controlled variables: Same spectroscope, same viewing distance, same slit width, same ambient darkness.
- Control observation: Use a white LED as a baseline because its spectrum is well documented.
What to Observe or Measure
For each light source, record:

- The number of colour bands you can clearly distinguish.
- Any missing colours (e.g., a weak red or blue).
- Relative brightness of the spectrum (bright, medium, faint).
- Sketch the spectrum on the provided data table.
Repeated Trials
Perform three trials for each light source. Between trials, rotate the spectroscope slightly to ensure the same part of the CD is used and to reduce systematic error.
Data Table
| Trial | Light Source | Number of Distinct Colour Bands | Missing Colours (if any) | Brightness (qualitative) | Sketch / Notes |
|---|---|---|---|---|---|
| 1 | |||||
| 2 | |||||
| 3 |
Graphing Your Results (Optional)
If you wish to visualise the data, plot “Light Source” on the horizontal axis and “Number of Distinct Colour Bands” on the vertical axis. Bar graphs work well for this categorical data.
Troubleshooting
- No spectrum appears: Check that the CD is positioned correctly (shiny side facing the slit) and that the viewing window is not covered.
- Spectrum looks fuzzy or dim: Make sure the slit is narrow and the ambient room lights are turned off as much as possible.
- Only a single colour is visible: Verify you are using a clean, unused CD. Scratched or dirty discs diffract light poorly.
- Sunlight causes eye discomfort: Never look directly at the sun; always use reflected sunlight on a wall.
Cleanup and Disposal
Collect all cardboard scraps for recycling, keep the CD for future projects, and store the finished spectroscope in a safe place. Dispose of any used tape rolls in the regular waste bin.
Next Steps
After completing the experiment, try using the spectroscope to compare the colour output of different coloured LEDs (red, green, blue) or to investigate the spectrum of a candle flame. You can also explore how the angle of the slit changes the spread of colours.
Related terms
- Spectrum
- The range of all colours (wavelengths) that make up light, visible as a rainbow when white light is split.
- Diffraction grating
- A surface with many closely spaced lines that bends (diffracts) light into its component colours.
- Wavelength
- The distance between successive peaks of a light wave; different wavelengths correspond to different colours.
Sources & references
- Australian National University – Split light into rainbows. https://science.anu.edu.au/engagement/science-lab-experiments-home-school/split-light-rainbows
- Fizzics Education – Make your own Spectrometer. https://www.fizzicseducation.com.au/150-science-experiments/light-sound-experiments/make-your-own-spectrometer/
- KiwiCo – DIY Spectroscope for Beginners. https://www.kiwico.com/diy/stem/quick-easy-experiments/spectroscope