Overview
Capillary action is the ability of a liquid to move through narrow spaces without the help of external forces. In plants, water climbs tiny tubes in roots and leaves thanks to this same principle. By changing the temperature of the water, we can see how two key properties—surface tension and viscosity—are altered, and how those changes affect the height and speed of the rise.
Before you begin
- Age range: 6‑14 years (younger children should work with adult supervision).
- Time commitment: About 30 minutes for setup, then 5‑10 minutes of waiting per trial. Expect a total session of 1‑1.5 hours including repeats.
- Safety notes: Use only safe kitchen‑grade water and food‑grade dye. Hot water should not exceed 60 °C (140 °F) to avoid burns; always test temperature with the back of your hand before handling.
- Workspace: A flat, stable surface near a sink for easy clean‑up.
Materials
- 3 clear plastic cups (or small glass jars) – same size.
- Paper towel or a strip of ordinary printer paper (about 2 cm wide, 15 cm long).
- Tap water.
- Food colouring (optional, for visual effect).
- Thermometer (digital or glass) – range 0‑100 °C.
- Kitchen thermometer or a microwave to warm water (see procedure).
- Ruler (centimetre scale) or a measuring tape.
- Stopwatch or phone timer.
- Pen/pencil and data sheet (provided in the Data Table section).
- Paper towels for spills.
All items are common household supplies; no specialized lab equipment is required.
Testable question
How does the temperature of water influence the height it climbs in a paper strip (and how fast it gets there)?
Hypothesis
Warmer water has lower surface tension and lower viscosity, so it should rise a shorter distance but do so more quickly than cold water. Conversely, colder water, with higher surface tension and higher viscosity, should climb higher but more slowly.

Variables and controls
| Variable type | Details |
|---|---|
| Independent variable | Water temperature (e.g., 5 °C, 20 °C, 35 °C, 50 °C). |
| Dependent variables | Maximum height reached (cm) and time to reach that height (seconds). |
| Controlled variables | Paper type and dimensions, water volume (≈30 mL per cup), ambient room temperature, cup placement, and measurement method. |
Procedure (Steps)
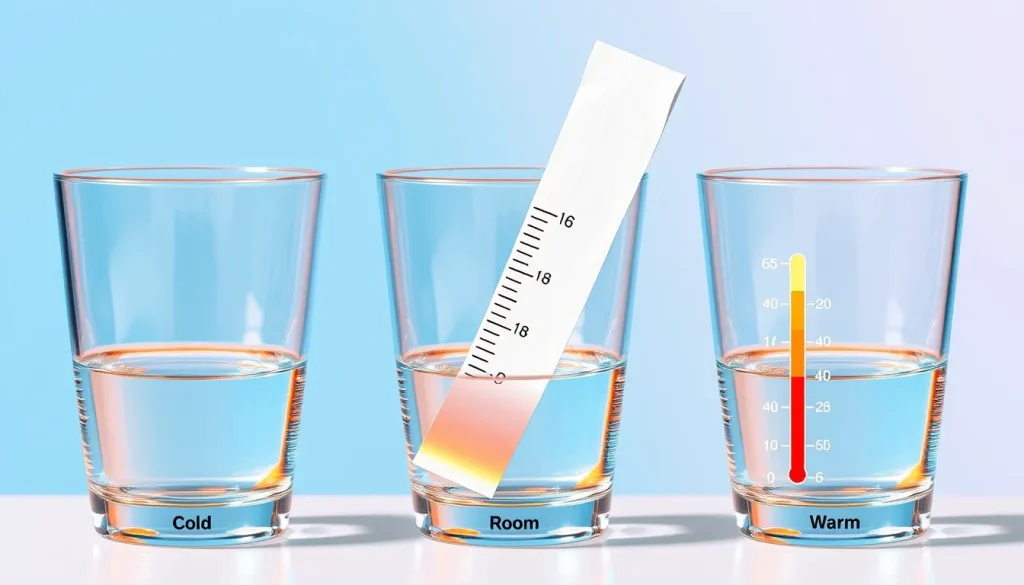
- Prepare three temperature levels. Fill three identical cups with the same amount of water (about 30 mL). Keep one cup at room temperature (~20 °C). Warm a second cup in a microwave or on the stove until it reaches ~50 °C (use the thermometer). Chill the third cup in a refrigerator or ice bath until it reaches ~5 °C.
- Label the cups. Write “Cold”, “Room”, and “Warm” on a piece of masking tape and stick it to each cup for easy identification.
- Optional colour. Add a drop of food colouring to each cup; this makes the rising front easier to see but does not affect the physics.
- Cut a paper strip. Use a ruler to cut a 2 cm‑wide, 15 cm‑long strip of paper towel or printer paper. Make sure the edges are straight.
- Set up the measurement station. Place a ruler vertically against a wall or a stand so the zero mark is at the bottom of the cup. Position the cup so the water surface is just touching the bottom of the ruler.
- Start the trial. Gently place one end of the paper strip into the water, letting the other end hang vertically beside the ruler. Start the stopwatch the moment the strip contacts the water.</n
- Record the rise. Observe the wet front moving up the paper. When the wet front stops moving (no further change for ~30 seconds), note the height (in cm) where the water has risen.
- Record the time. If you prefer to measure speed, stop the timer when the wet front reaches a pre‑marked height (e.g., 5 cm) and record that time.
- Repeat. Remove the strip, dry the cup, and repeat the same steps for the other two temperature levels. Perform at least three trials for each temperature to capture variation.
- Clean up. Dispose of the water down the sink, wipe any spills, and store the paper strips for later observation if desired.
What to observe or measure
- Maximum height (cm): The final position of the wet front measured against the ruler.
- Time to reach a set height (seconds): Optional – useful for seeing speed differences.
- Qualitative notes: Colour intensity, any uneven rise, or paper warping.
Data table
| Trial | Temperature (°C) | Maximum height (cm) | Time to reach 5 cm (s) (optional) | Notes |
|---|---|---|---|---|
| 1 | ||||
| 2 | ||||
| 3 | ||||
| 4 | ||||
| 5 | ||||
| 6 |
Leave the cells blank while you work; fill in after each trial.
Graphing your results
Plot a simple line graph:
- X‑axis: Water temperature (°C).
- Y‑axis (left): Maximum height (cm).
- Optional second Y‑axis: Time to reach 5 cm (s).
Connect the points for each temperature; the trend will illustrate how temperature influences capillary rise.
The science explained
Capillary action occurs because of two molecular forces:
- Cohesion: Water molecules attract each other, creating surface tension.
- Adhesion: Water molecules are attracted to the fibres of the paper, pulling the liquid upward.
Washburn’s equation describes the relationship between the height (or length) a liquid climbs in a porous material and time, viscosity (η) and surface tension (γ):
L² = (γ D t) ⁄ (4 η)
where L is the distance travelled, D the average pore diameter, t time, γ surface tension, and η viscosity. Both γ and η change with temperature: as temperature rises, surface tension drops and viscosity falls. The lower viscosity lets water move faster, but the reduced surface tension weakens the pulling force, so the liquid often stops sooner, giving a lower final height. Cold water has higher surface tension and higher viscosity, leading to a slower but higher rise. This is exactly what the hypothesis predicts and what the experiment tests [2].
The walking‑water demonstrations you may have seen elsewhere show capillary action in action, but they keep the water at room temperature, so temperature effects are hidden [1][3][4]. Our experiment isolates temperature as the variable.
Troubleshooting
- Water doesn’t rise at all: Ensure the paper is absorbent (paper towel works best) and that the strip is fully in contact with the water surface.
- Uneven rise or blotches: Check that the paper strip is straight and not folded. A bent strip creates thicker sections that impede flow.
- Temperature changes during the trial: Perform trials quickly after setting the temperature, and keep the cup insulated (e.g., wrap a towel around a cold cup) to maintain the target temperature.
- Measurements vary widely: Record multiple trials and average the results. Small differences in paper texture can cause variation.
Try another version
Once you’ve mastered the basic test, you can explore further:
- Use different liquids such as vinegar or diluted soap solution to see how surface tension changes affect the rise.
- Swap paper towel for a coffee filter, cotton cloth, or sand‑filled capillary tube and compare results.
- Add a second colour to each temperature level and watch colour mixing as the fronts meet.
- Measure the effect of adding a tiny amount of salt to the water, which raises surface tension.
Cleanup and disposal
All materials are safe to discard down the sink. Wipe the work surface with a damp cloth. If you used food colouring, rinse any cups to avoid staining.
Next steps
Discuss with children how plants rely on capillary action to bring water from roots to leaves, and why temperature changes in soil might affect plant hydration. You can also link this activity to a broader study of fluid dynamics, such as how ink moves in a fountain pen or how oil spreads on water.
Related terms
- Surface tension
- A property of liquid surfaces that makes them act like a stretched elastic membrane, caused by cohesive forces between molecules.
- Viscosity
- A measure of a fluid’s resistance to flow; thicker liquids have higher viscosity.
- Capillary action
- The movement of liquid within narrow spaces due to the combined effects of adhesion and cohesion.