Overview
This project lets children test a common claim – that playing music for a growing plant speeds up its development. The activity is designed so the hypothesis may be supported, partially supported, or not supported at all. When the data do not match the prediction, learners practice the same skills scientists use to handle unexpected results (see Good Research Practice Roadmap) [1]. The experiment also demonstrates good reporting practices for negative findings [3] and how to discuss results without bias [2].
Before You Begin
- Choose a quiet workspace where the same amount of daylight reaches each seed tray.
- Gather an adult to help with measuring water and setting up the music source.
- Plan for a minimum of two weeks of observation – plant growth is slow.
Materials
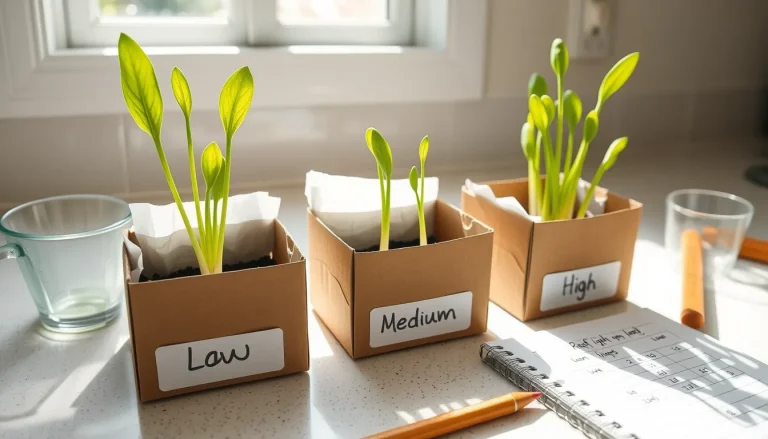
- 10 small paper cups (or recycled cardboard cups) – one for each seed.
- Paper towel or cotton pads to line the cups.
- 10 fast‑germinating seeds (e.g., radish or bean).
- Water in a small measuring cup.
- Two identical trays or shallow containers to hold the cups.
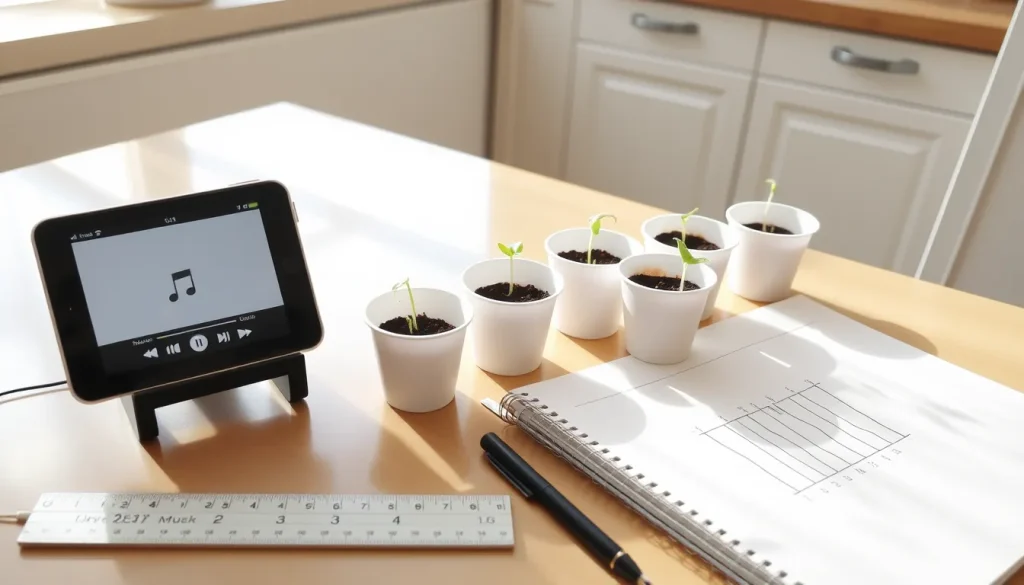
- A simple music player (smartphone, tablet, or small speaker).
- Timer or stopwatch.
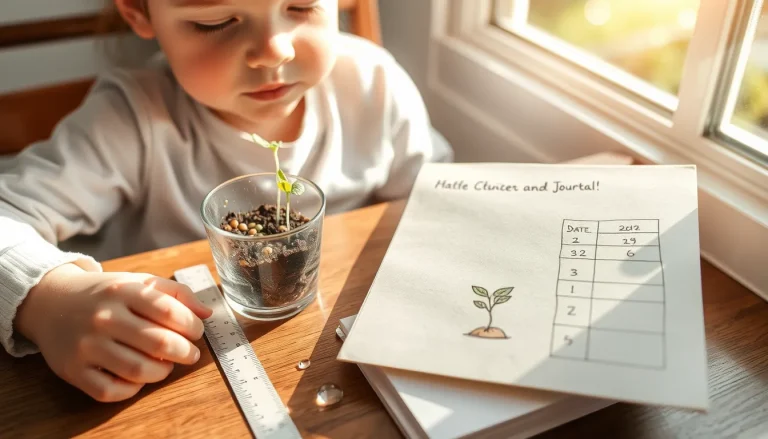
- Ruler (centimetre scale) for measuring shoot length.</n
- Notebook or printed data table (see below) for recording observations.
Testable Question
Does playing classical music for a growing seed increase the length of its shoot after two weeks compared with a silent control?
Hypothesis
If seeds are exposed to classical music for 30 minutes each day, then their shoots will be longer after two weeks than shoots of seeds that receive no music.
Variables and Controls
| Type | Variable | How it is kept constant |
|---|---|---|
| Independent | Music exposure (30 min/day vs. none) | Same music piece, same volume (≈60 dB), same time of day |
| Dependent | Shoot length (cm) after 14 days | Measured with the same ruler, same day, same lighting |
| Controlled | Seed type, soil moisture, light exposure, temperature, cup size | All cups placed side‑by‑side, watered equally, same room |
Steps (Procedure)
- Label five cups “Music” and five cups “Silent” using a pencil.
- Place a damp paper towel or cotton pad in each cup.
- Moisten until the material is wet but not dripping.
- Plant one seed in the centre of each cup, about 1 cm deep.
- Cover gently with the damp material.
- Arrange the ten cups in two rows on a tray, keeping the two groups side‑by‑side so they receive identical daylight.
- Start the 14‑day observation period. Every day:
- Water each cup with exactly 10 ml of water (use a measuring spoon).
- Play the chosen classical piece for the “Music” group for 30 minutes. Keep the volume at a comfortable listening level (≈60 dB). The “Silent” group receives no sound.
- At the end of each day, note any visible changes (e.g., sprouting, leaf colour) in the notebook.
- After 14 days, measure the longest shoot in each cup with the ruler. Record the length to the nearest millimetre.
- Enter all measurements in the data table provided below.
- Create a simple bar graph comparing the average shoot length of the Music group versus the Silent group.
What to Observe or Measure
- Qualitative observations: date of germination, colour of cotyledons, signs of wilting.
- Quantitative measurement: shoot length (cm) after 14 days.
Data Table (Blank)
| Cup ID | Group | Day of germination | Shoot length (cm) after 14 days |
|---|---|---|---|
| 1 | Music | ||
| 2 | Music | ||
| 3 | Music | ||
| 4 | Music | ||
| 5 | Music | ||
| 6 | Silent | ||
| 7 | Silent | ||
| 8 | Silent | ||
| 9 | Silent | ||
| 10 | Silent |
Graphing Your Results
Use a bar graph with two bars: one for the average shoot length of the Music group and one for the Silent group. Label the vertical axis “Average shoot length (cm)” and the horizontal axis “Treatment”. Adding error bars (standard deviation) helps show natural variation.
The Science Explained
Plants grow by converting light, water, and carbon dioxide into sugars through photosynthesis. The claim that music influences growth is based on the idea that sound vibrations might affect cell‑division rates or hormone signalling. However, scientific studies have shown mixed results, and many “positive” findings turn out to be false positives or context‑specific [3]. In this experiment, any difference (or lack thereof) can be interpreted in several ways:
- True negative: Music genuinely has no effect under the conditions used.
- False negative: An effect exists but was hidden by experimental noise (e.g., inconsistent watering, temperature fluctuations).
- Contextual factor: The type of music, volume, or plant species might matter.
Recognizing these possibilities mirrors the guidance for handling unexpected outcomes [1]. The key is to treat the data as evidence, not as proof of personal belief.
Troubleshooting Unexpected (or Null) Results
- Inconsistent water amounts: Re‑measure each day with a syringe or graduated cylinder.
- Variable light: Rotate the trays daily to average out any shadow differences.
- Music volume too low or too high: Verify volume with a smartphone sound‑meter app; aim for 60 dB.
- Seed viability: Use fresh, high‑germination‑rate seeds; discard any that never sprout.
Document any changes you make; they become part of the next iteration of the investigation.
Common Misconceptions
- “If the result is negative, the experiment failed.” – Not true. A well‑designed experiment can produce a valid null result, which is scientifically valuable [3].
- “Only a significant p‑value matters.” – For young learners, focus on the size of the effect and whether the data are consistent, not on statistical significance alone [2].
- “My hypothesis must be right because I believed it.” – Science tests ideas; when evidence disagrees, the hypothesis is revised, not discarded as a personal failure [4].
Next Steps and Extensions
- Try a different genre of music (e.g., rock, silence, or white noise) and repeat the 14‑day cycle.
- Use a different plant species to see whether the response is species‑specific.
- Increase the observation period to 3–4 weeks and track leaf number as an additional dependent variable.
- Turn the activity into a science‑fair investigation by adding more replicates and calculating an average and a simple statistical comparison (e.g., t‑test) with adult guidance.
Cleanup and Disposal
After the experiment, discard the used paper cups in the recycling bin, compost any plant material if possible, and wipe the tray with a damp cloth. Store the ruler and notebook for future projects.
Sources & references
- Handling the Unexpected | Good Research Practice Roadmap, 2025. https://goodresearchpracticeroadmap.github.io/content/doing/handling-unexpected.html
- Results and Discussion. https://psych.hanover.edu/classes/ResearchMethods/Readings/Results_Discussion.pdf
- Beyond the null: Recognizing and reporting true negative findings. iScience, 2024. https://doi.org/10.1016/j.isci.2024.111676
- What If Your Evidence Contradicts the Theory? https://manuelgarcia.info/guides/research/guide/theory-evidence-conflict